How Cloudockit Can Help You Visualize Your Google Cloud Platform Projects
Congratulations! You have deployed projects in GCP (Google Cloud Platform).
Now what? You need to ensure that your projects work on a long-term basis and that you can continually support it. It is critical to understand what has been deployed and ensure you have up-to-date documentation.
Let’s have a look at how Cloudockit can help you achieve your goals
1. Visualize Your GCP Projects With Complete Diagrams
Cloudockit will do the heavy job for you! It will automatically scan your Google Cloud Projects and detect the dependencies between all the components.
Below is an example of diagrams automatically generated by Cloudockit:
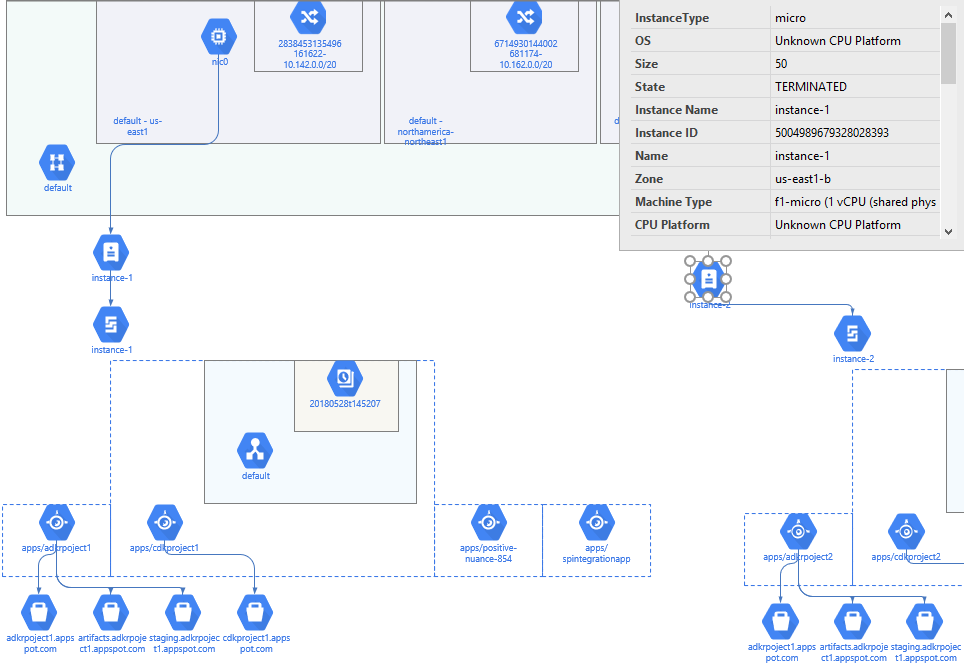
As shown in the diagram, Cloudockit has automatically detected 2 VM Instances, their associated disks and Network Cards. The software also detected App Engines and their links to Buckets.
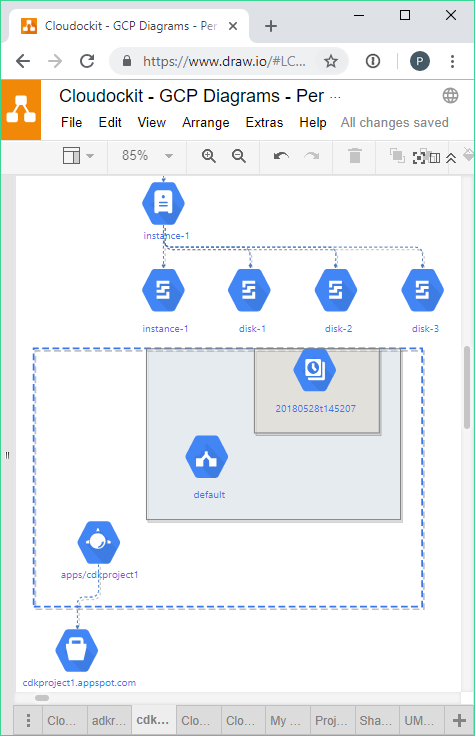
Cloudockit supports Microsoft Visio and Draw.io for your diagramming needs. It also automatically organizes the diagrams in different ways in order to be understood by multiple audiences. For example, the diagram on the right is organized by Projects, with a tab for each of your projects.
2. Get Complete GCP Technical Documentation
Cloudockit automatically generates a full Word document with all the pertinent details. It also contains embedded diagrams to easily visualize what is deployed.
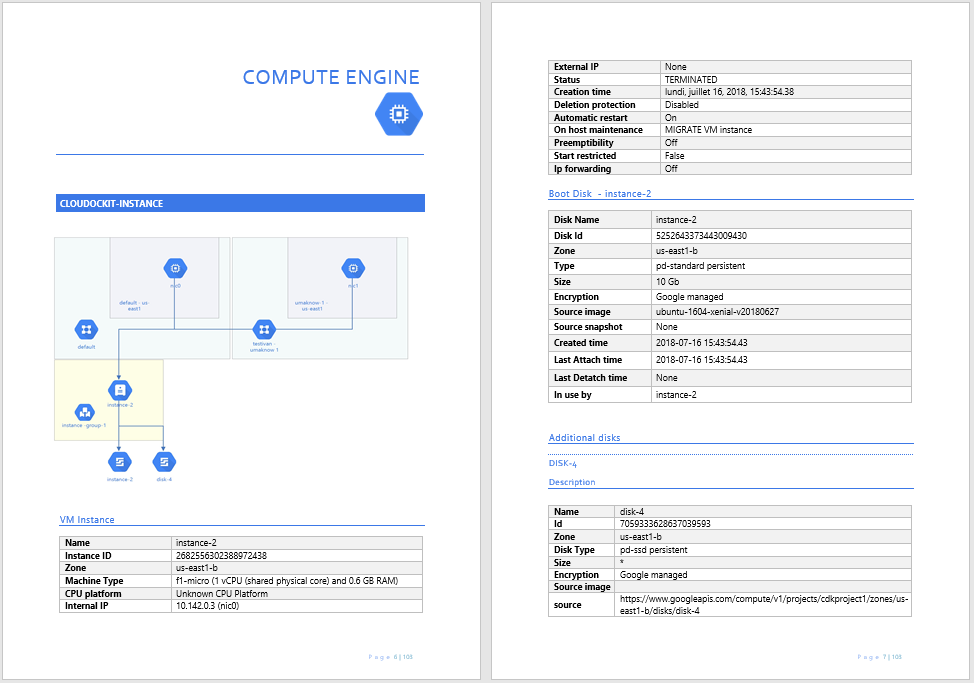
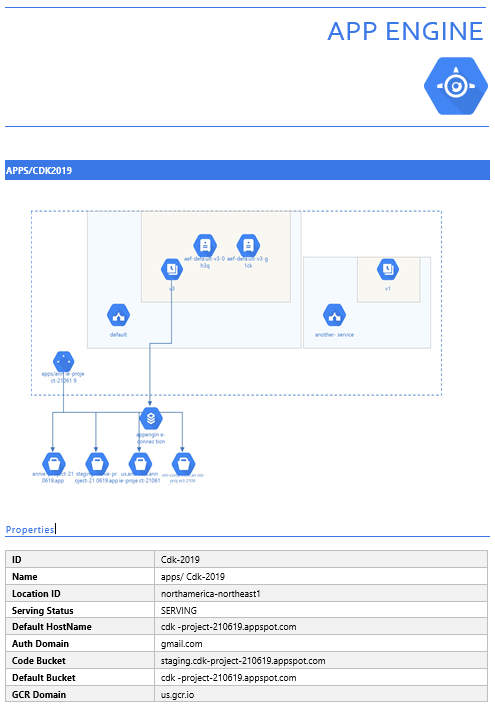
In addition to the IaaS components, we do provide support for many Workloads in Google like App Engine (cf. screenshot on the left).
The following is a list of some Workload Types that we support:
- Compute Engine
- App Engine
- Kubernetes Engine
- Cloud Functions
- Bigtable
- Cloud Storage
- Cloud SQL
- Networking
- VPC Network
- Cloud Load Balancing
- Identity & Security
- Cloud IAM
Cloudockit’s GCP diagram generator will save you time and money
3. Get a full Excel report of all your GCP Components
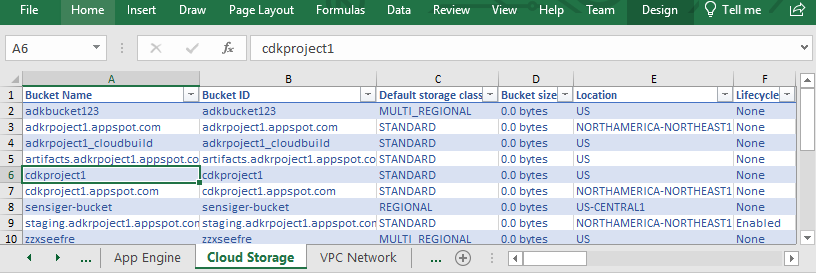
In addition to diagrams and Workloads, Cloudockit also automatically exports all your GCP Components into an Excel File.
This will automatically generate an Excel Tab per Workload Type you are using in one of your GCP Projects. From there, you work directly in Excel to create your own complex reports without having to code the GCP components retrieval yourself.
Here is an example of report for the storages:
4. Keep your GCP Projects compliant
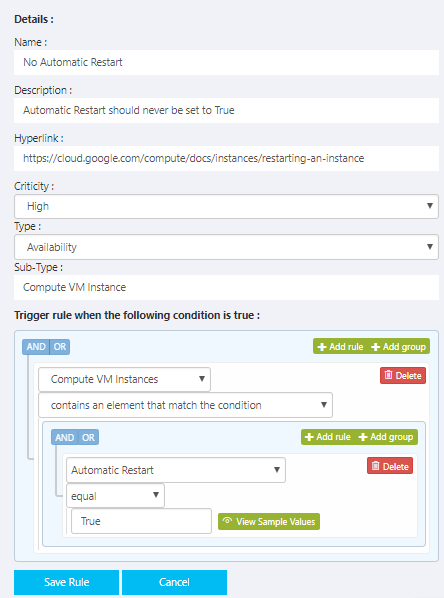
Cloudockit automatically embeds data into the Shapes that it generates. You can use this data to see the details of each component and to generate rules in Visio.
A good example would be to create a rule where you show a Red icon for Virtual Machines that are in the Stopped state and a Green icon for Virtual Machines that are in the Running state.
We are currently working to integrate these new rules directly in the product.