

Knowledge Base
Tailored Diagrams Basics
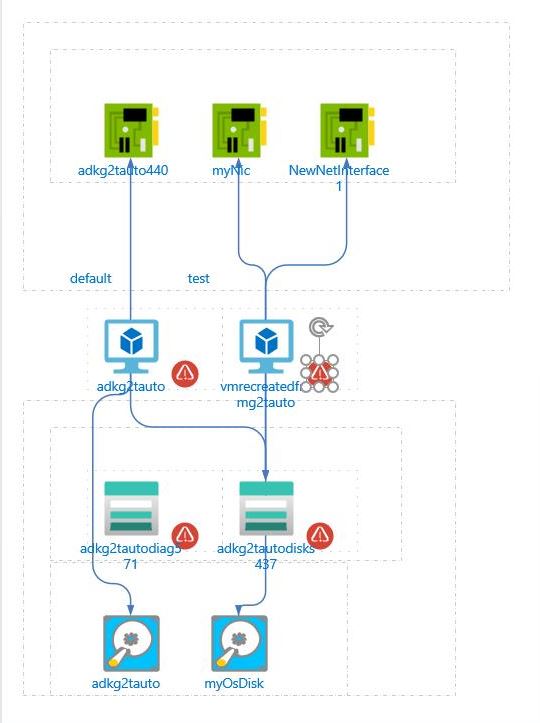
With Cloudockit Tailored Diagrams, you are able to specify how your Cloud components are laid out based on the different types of links Cloudockit is able to detect. The two major types of links detected by Cloudockit are:
Aggregation: A component is inside another component or belongs to another component. For example, there is an Aggregation link between an Azure Resource Group and an Azure Subscription because an Azure Resource Group is inside an Azure Subscription. Also, there is an Aggregation link between a Subnet and an AWS VPC as a subnet belongs to a VPC.
Connection: A connection relationship indicates that a system is connected to another system and uses it. For example, A Network Interface Card is connected to a Virtual Machine, An Azure Traffic Manager is connected to an Azure App Service.
Tailored Diagrams allow Cloudockit users to specify how they would like the diagram to be built. To access the module, click the expand button on the Diagrams Section.
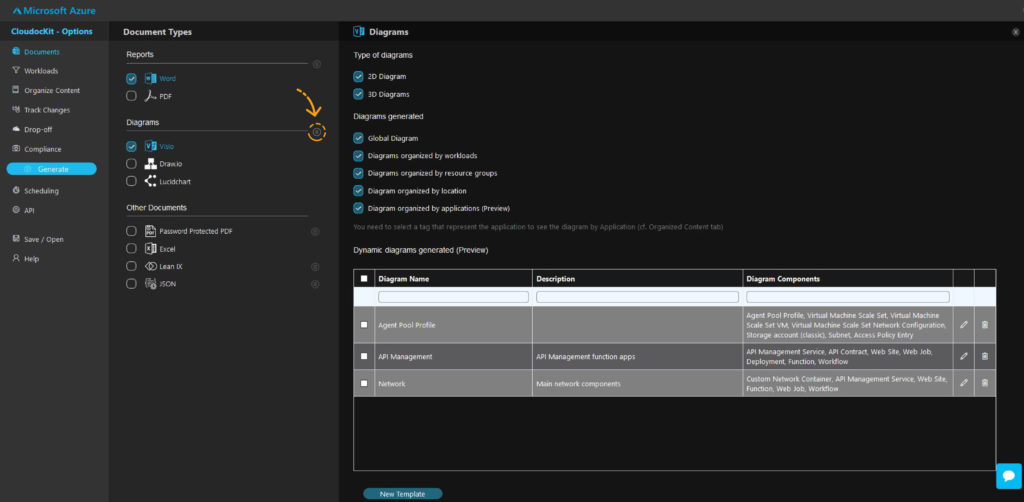
The user can view, edit, or delete their dynamic diagrams. To generate dynamic diagrams, simply check the checkboxes in the dynamic diagrams generated section.
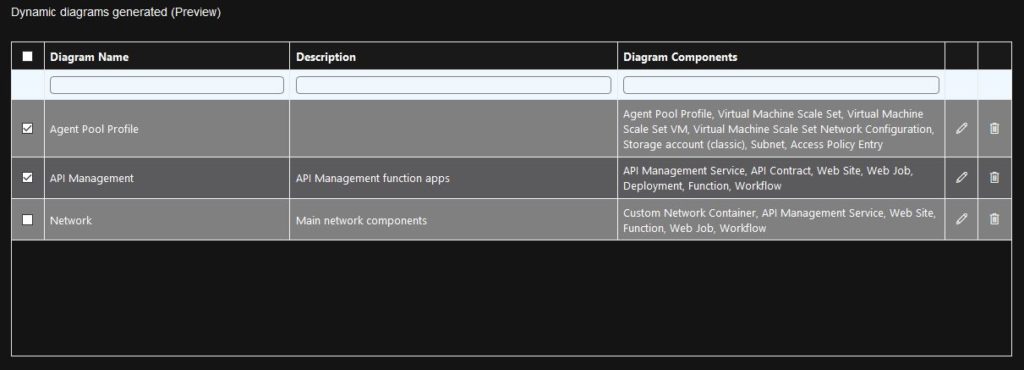
To add a new template, simply click the New Template button.
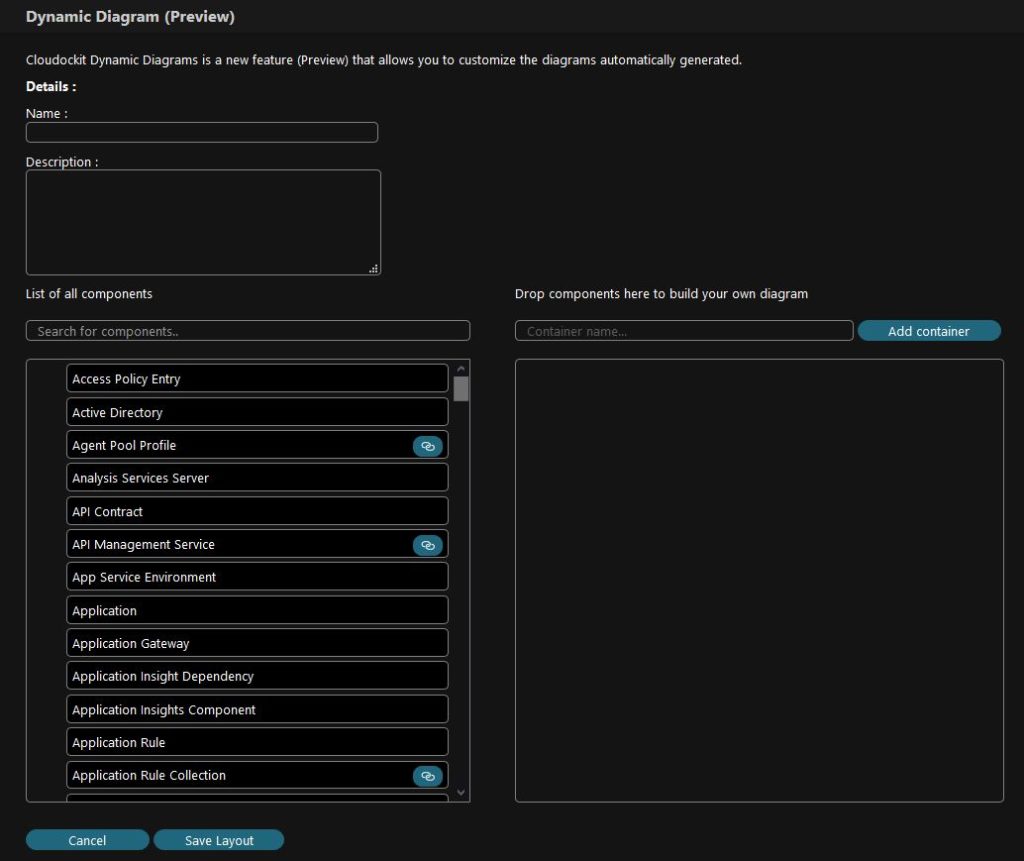
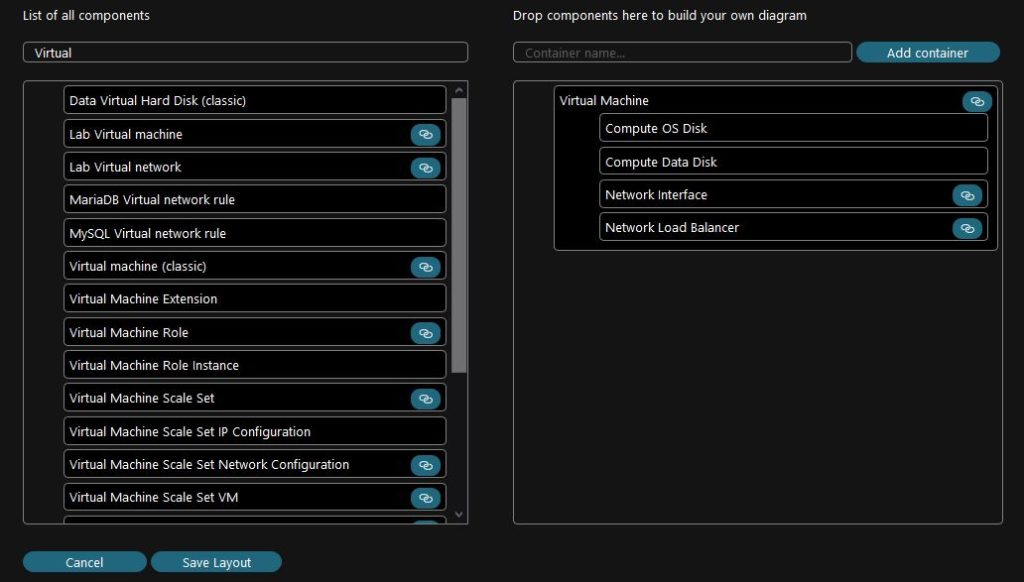
A list of all component types is detected by Cloudockit and displayed. All components can be dragged and dropped into the right canvas. To facilitate the layout creation, you can filter the list of components.
For example, you can filter the word machine, drag the Virtual Machine component and drop it into the Canvas:
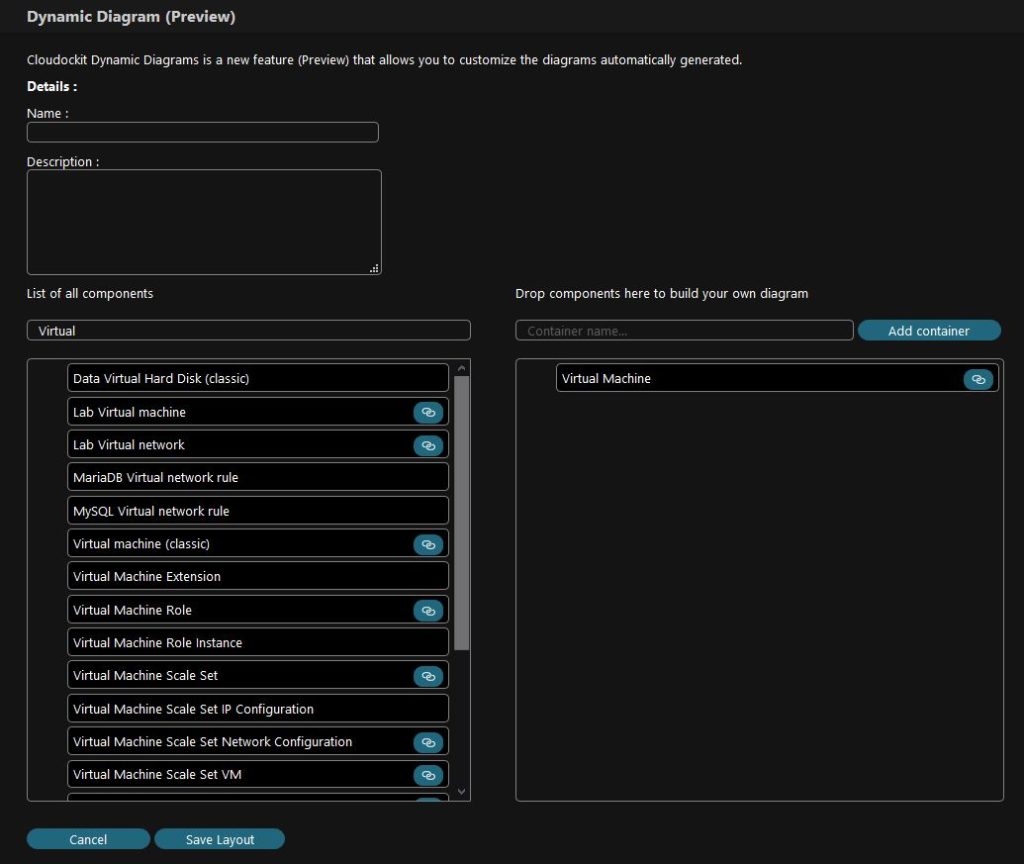
If the component contains other linked components, a button will be displayed next to it. At any time, it is possible to click the link button and add its dependencies.
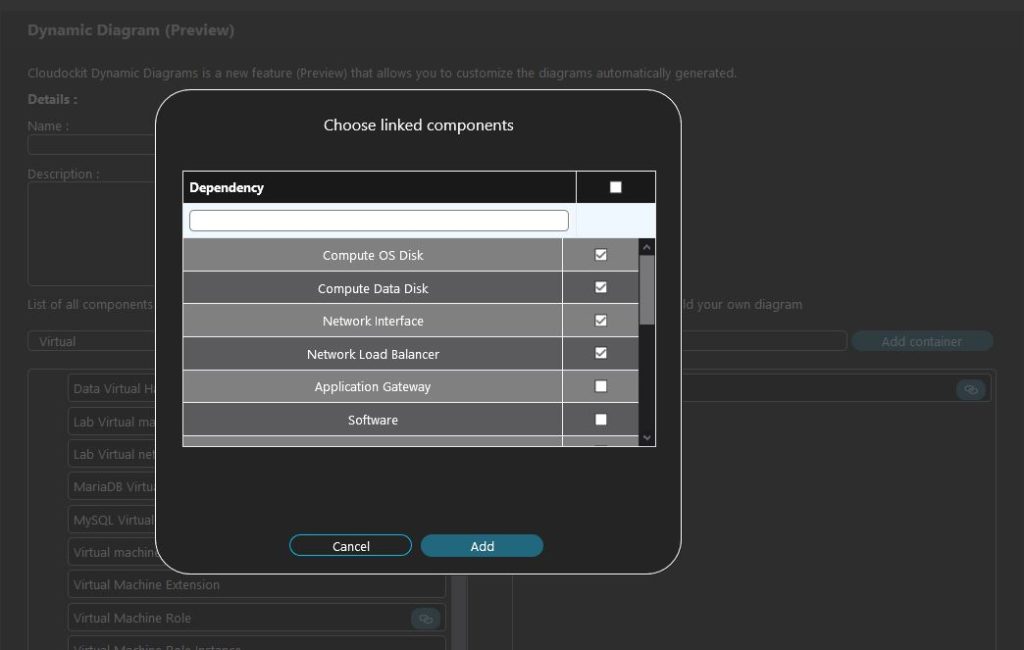
Furthermore, when a component has possible links and is dropped into the main right canvas, the pop-up to add linked components is shown automatically.
Every component can be moved with a drag a mouse and nested within each other.
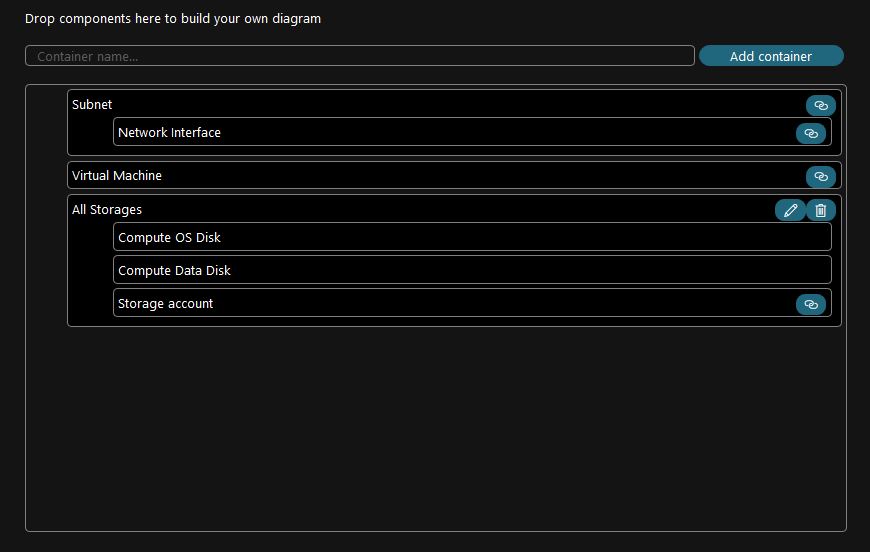
The Add Container button lets you add a custom container that acts as a separator in the Visio diagram.
Please note: The tailored diagrams are only compatible with Visio at the moment.
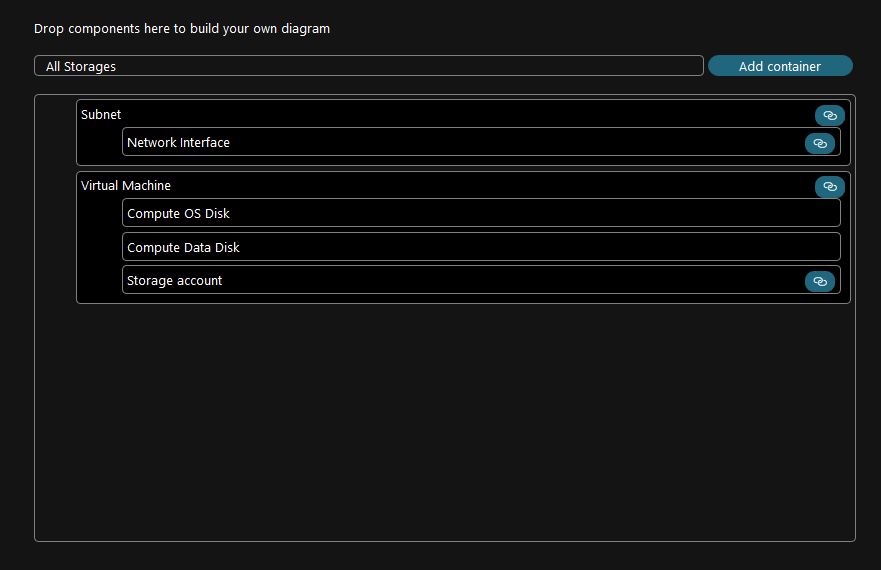
Here is an example of a the “All Storages” custom container being used:
This will create the following Visio Diagram:
As you can see, the “All Storage” custom container contains VM OS Disks and Data Disks in a top-level container.