

Knowledge Base
How to best use Cloudockit Diagrams ?
This article gives insight on how to best use Cloudockit Diagrams. There are multiple options to generate Cloudockit Diagrams and many best practices to nicely edit your generated diagrams.
Types of Diagrams
Cloudockit supports the following outputs:
- Visio
- Lucidchart
- Diagrams.net – Please note that there are two outputs for diagrams.net:
- Native .xml draw.io file
- Draw.io files that result of Visio file conversion
Not all the formats have the same feature sets. Below is a comparison of the different features available for each format:
| Format | Editable | Contains shapes metadata | Hyperlinks on shapes | Show Indicators (track changes, warnings) | Support Tailored Diagrams | Support Refresh service |
|---|---|---|---|---|---|---|
| Visio | Yes | Yes | Yes | Yes | Yes | Yes |
| Lucidchart | Yes | Yes | Yes | Yes | Yes | No |
Draw.io | Yes | Yes | Yes | Yes | Yes | No |
| PDF Diagrams | No | No | Yes | Yes | Yes | No |
Diagram Layout Offered by Cloudockit
Now that you can select the output file format, you can choose the type of diagram Cloudockit will generate for you.
There are two types of layouts:
- The diagrams that Cloudockit has pre-programmed for you
- The tailored diagrams you create exactly as you want
Cloudockit contains the following five types of pre-programmed diagrams:
| Type of diagram | Description |
|---|---|
| Global Diagram | This diagram contains everything scanned in your environment. It contains multiple tabs that include the following information:
|
| Diagrams organized by workloads | This diagram has one tab per type of component (one tab for storage accounts, one tab for virtual machines…) |
| Diagrams organized by Resource Groups | This diagram has one tab per Resource Group |
| Diagrams organized by Location | This diagram has one tab per Location |
| Diagrams organized by Application | This diagram has one tab per Application. You must specify how Cloudockit can group your resources by Application in the Organize Content Tab. |
For the tailored diagrams, please refer to this link for more information: https://www.cloudockit.com/tailored-diagram-generator/
Options to Generate Diagrams
Cloudockit offers the following options that you can use to improve the generated diagrams and make it exactly as you need:
| Option | Description | Example |
|---|---|---|
| Show links as colored boxes | Instead of having arrows to indicate that components are linked, Cloudockit can generate small colored boxes that will help you see which components are connected without the difficulties or reading a diagram where many arrows cross. | 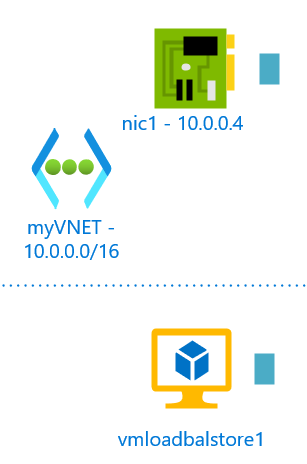 |
| Show exhaustive list of Resources | At times, some components are not linked to any other components in your cloud environments. By default, those components are not shown in the diagrams. You can click on this checkbox to have them shown in a separate box. | |
| Show warning flags | This will display a warning flag with the description of the warning(s) in the flag shape data. This will help you identify which resources are not compliant. | 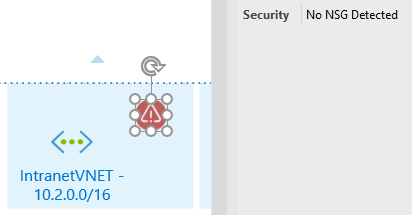 |
| Show changes in flags | This will display a flag that indicates if there has been a change since the last diagram generation. This needs to be used in conjunction with the Cloudockit Track Changes feature. | 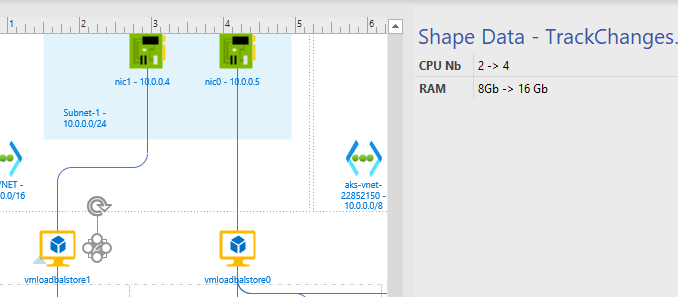 |
| Diagram Layout Optimization Level | These are algorithms that we test to improve the layout of the diagram. By choosing it, you should see fewer arrow crossings. | |
| Use png icons instead of Vector Shapes when more than 2000 resources are found | When you generate diagrams for a huge environment, you can get thousands of shapes which could make the diagram tough to open on some workstation. With this setting, Cloudockit will use png icons instead of vector shapes to decrease the size of the document. |
Best practices to work in Cloudockit Diagrams
In this section, you will find best practices and tips to better use Cloudockit diagrams in the different tools that Cloudockit supports.
VISIO DIAGRAMS
Cloudockit generates .vsdx files that are of course completely editable. Here are a few tips that you can leverage to best use your Cloudockit Diagram.
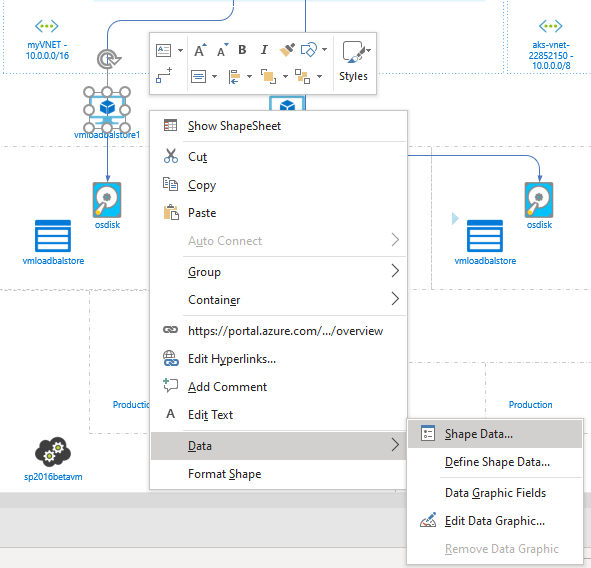
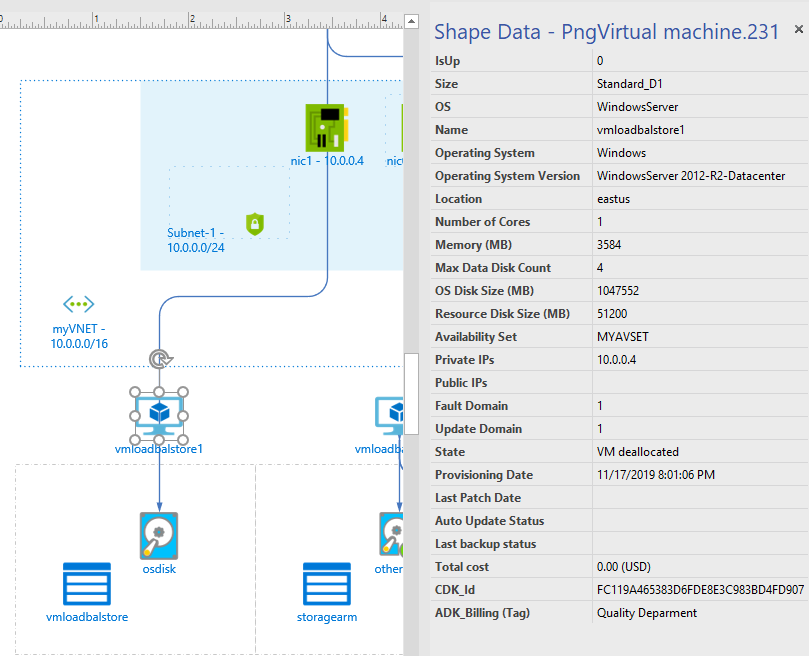
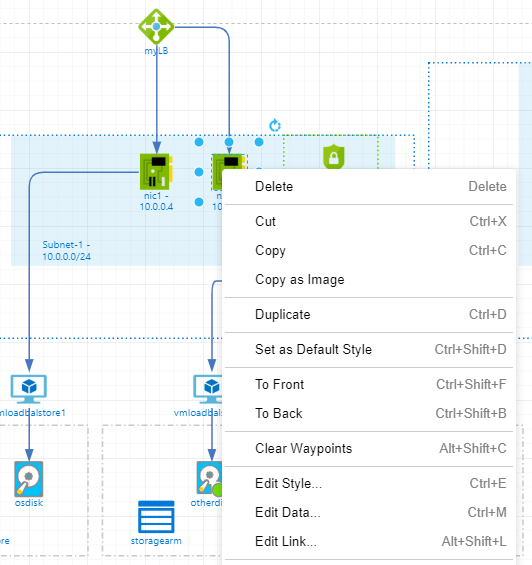
Show Shape Data
To have all the details about a component, you need to right-click on a Shape and select Shape Data. This will open the Shape Data Pane with all of the details:
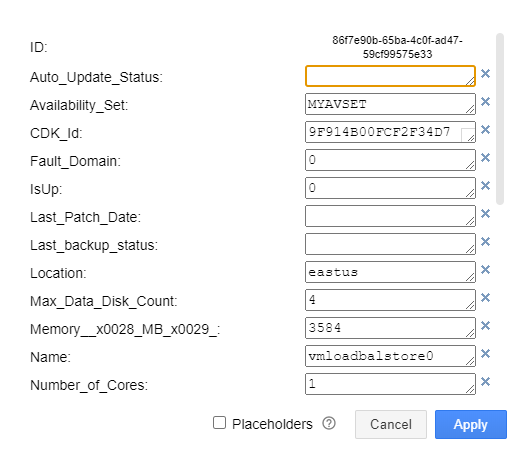
It will then display a side pane with all of the details:
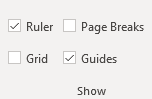
Hide Page Breaks for a clear view
By default, Visio will display Page Breaks in the Visio diagrams which creates vertical and horizontal lines. We recommend that you uncheck the Page Breaks and Grid options from the View Tab:
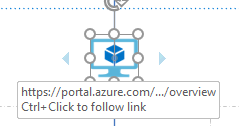
Navigate directly to the Azure Portal (under development for other Cloud Providers)
If you click on a Shape, it will open the Azure Portal directly to the settings of the component you just clicked:
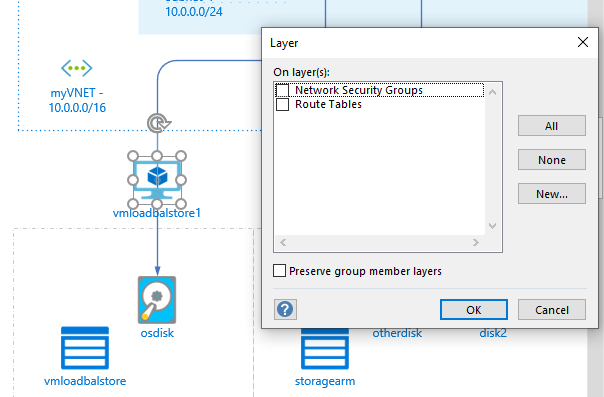
Use Layers
Visio supports layers, which means that you can organize your shapes in different layers and then show/hide components depending on the layers. Cloudockit generation leverages layers natively for some type of components like Network Security Groups or Route Tables:
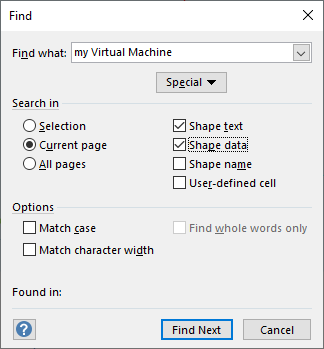
Search for shapes
Visio offers interesting Search features that will easily allow you to search for your resources in the diagrams. It also can search inside Shape data which is useful with Cloudockit as it automatically provisions shape data with the components settings:
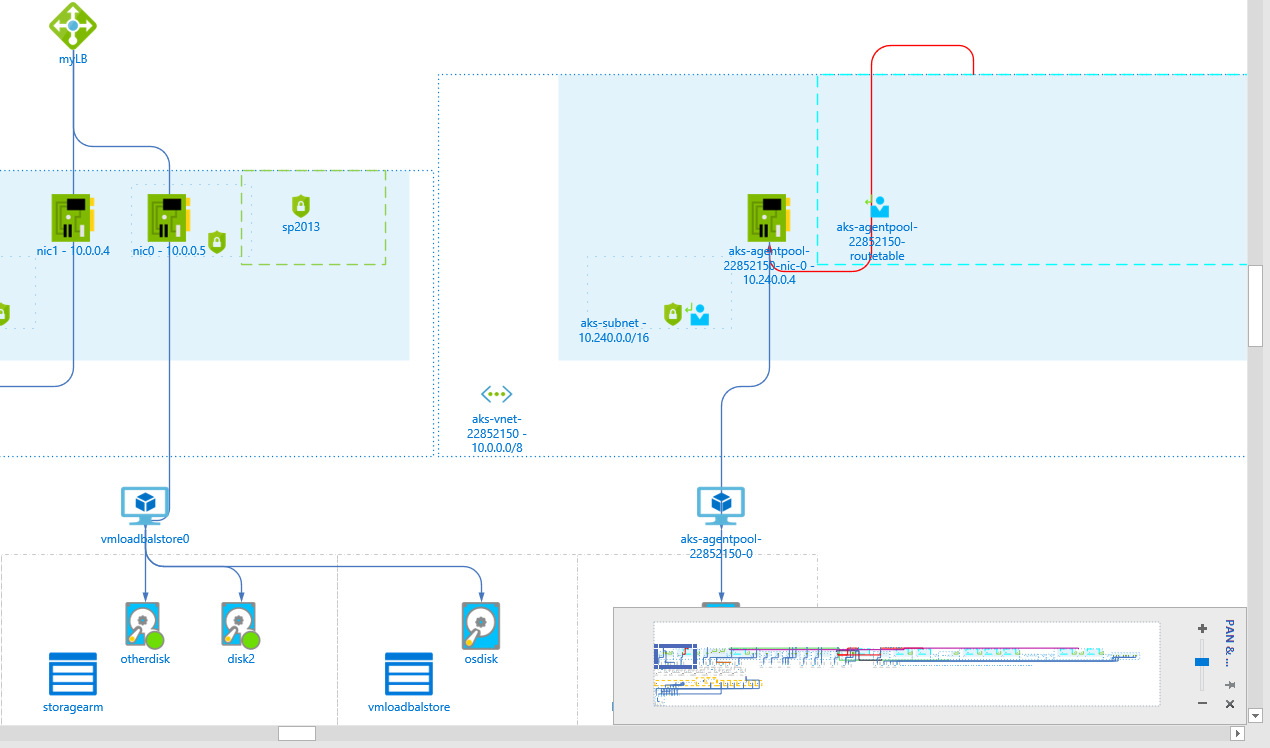
Use Pan & Zoom for easy navigation
If you have large diagrams, you can use the Visio Pan & Zoom navigation by going in the View tab/Task Panes/Pan & Zoom.
This gives you an easy way to navigate in your diagram with the Pan & Zoom Window:
DIAGRAMS.NET (DRAW.IO) DIAGRAMS
Show shape data (draw.io xml file only)
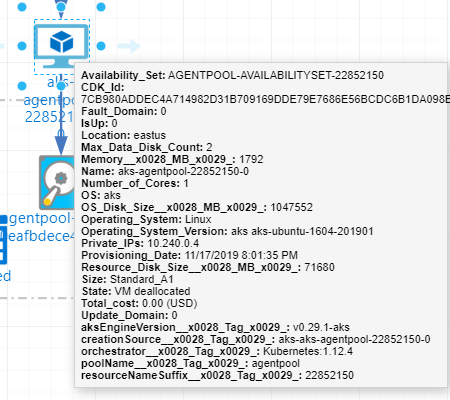
To have all the details about a component, you need to right-click on a Shape and select Edit Data.
This will display the Shape Data Pane with all of the details:
It will then display a side pane with all of the details:
Note that you can receive the same information by just hovering the shape:
Search for shapes
If you hit Ctrl+F, you will be able to search for shapes:
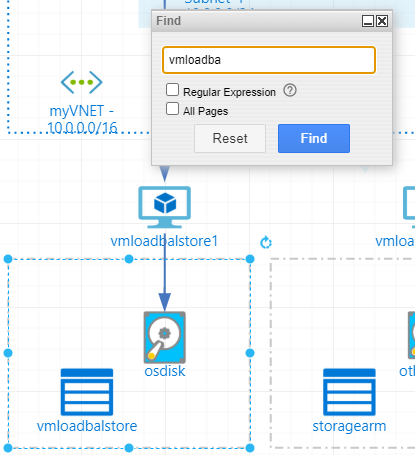
Please note that you can also search using a regular expression which is quite useful if you have strong naming conventions in your cloud deployments.
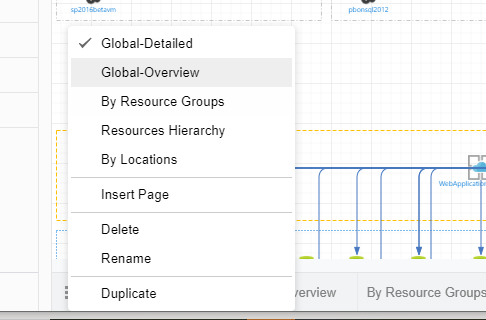
Navigate in diagrams with many tabs
Cloudockit creates diagrams that allow for many tabs like the ByResourceGroups diagram that will create a tab per resource group.
To easily switch between tabs, we recommend using the easy switch feature of draw.io :
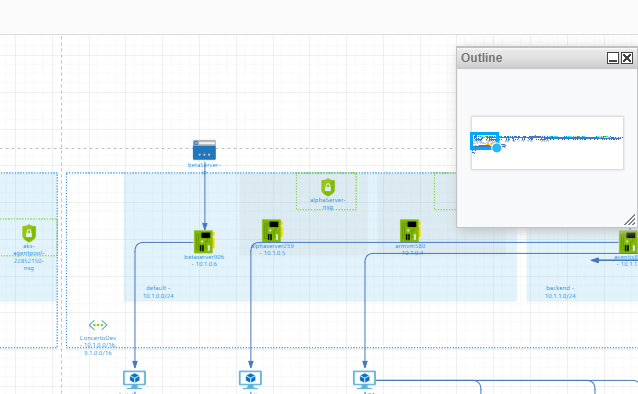
Use Outline for easy navigation
If you have large diagrams, you can use the Draw.io Outline navigation by selecting the View tab/Outline option.
This gives you an easy way to navigate in your diagram with the Outline Popup:
LUCIDCHART DIAGRAMS
Note that you need to have a version that allows you to edit the diagrams to be able to play with Lucidchart diagrams automatically created by Cloudockit.
Search for shapes
Lucidchart can search shapes by names by typing Ctrl+F:
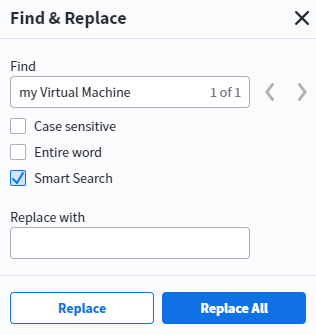
Please note that you can also search in the Shape data by activating the Smart Search.
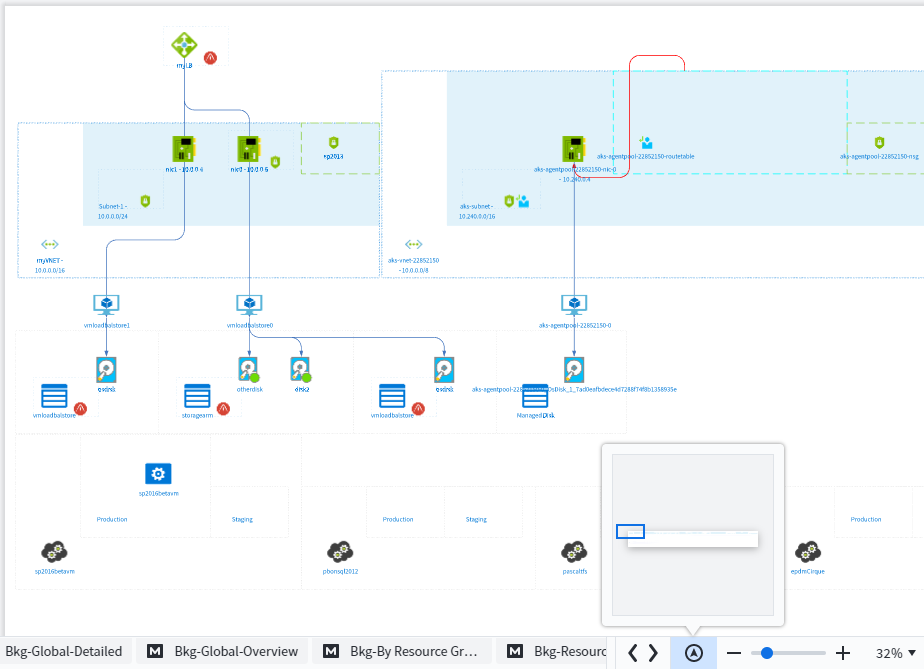
Use Outline for easy navigation
As for Visio and Diagrams.net, Lucidchart also can Pan& Zoom by clicking the navigation bar at the bottom of the screen:
Navigate directly to the Azure Portal (under development for other Cloud Providers)
If you click on a Shape, it will open the Azure Portal directly to the settings of the component you just clicked.
PDF DIAGRAMS
PDF Diagrams are read-only so there are not many options to play with. They are basically multi-page documents that contain the diagrams:
Note that these diagrams support the link (Azure only for now) to the resources in the Administration portal.