

Knowledge Base
How to configure Excel Reports
Cloudockit’s high-level reports will help you to quickly view changes in your resources, resource categories, resource types, applications, warnings, and their costs. Follow the step-by-step guide below.
Choosing Your Subscriptions/Accounts/Projects
After login in on generate.cloudockit.com, you will have the option of choosing the subscriptions/accounts/projects you would like to document.
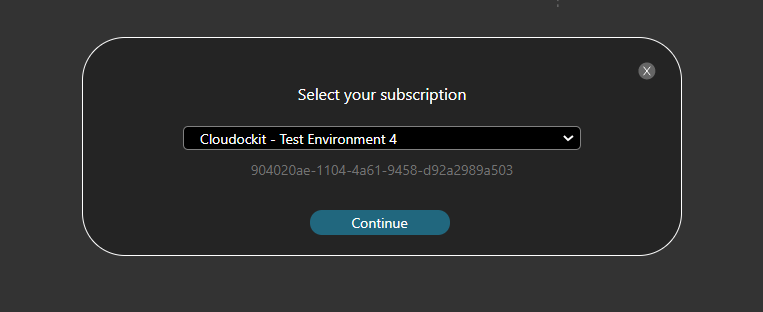
Cloudockit SaaS
With Cloudockit SaaS, you only have the option of documenting 1subscription/account/project at a time. Select the one you wish to document.
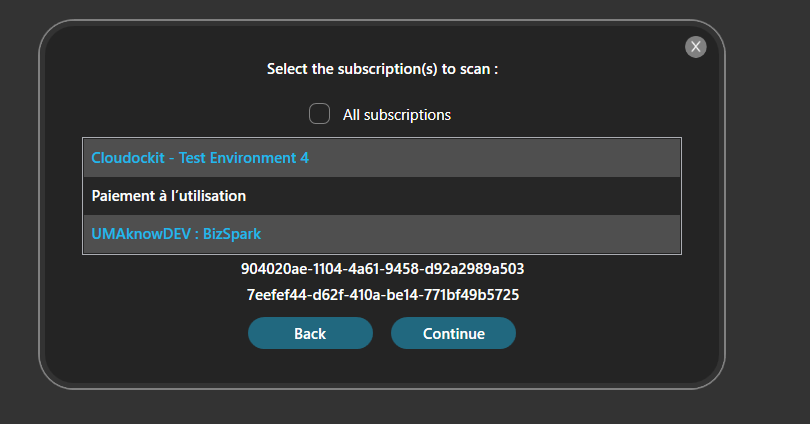
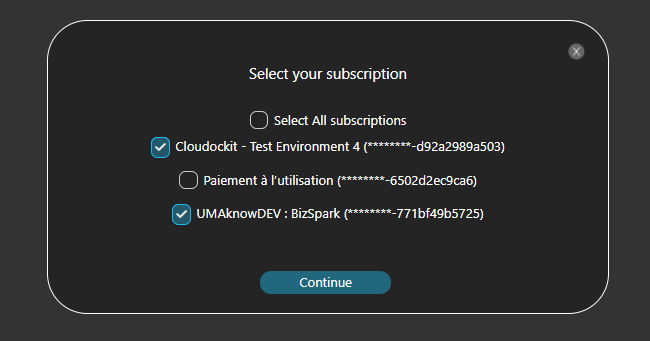
Cloudockit Desktop & Container
Select the subscriptions/accounts/projects you wish to document or select the check box All Subscriptions.
Please note that for Google Cloud billing data, only 1 project can be selected at a time
Setting-up in Cloudockit
Documents Tab
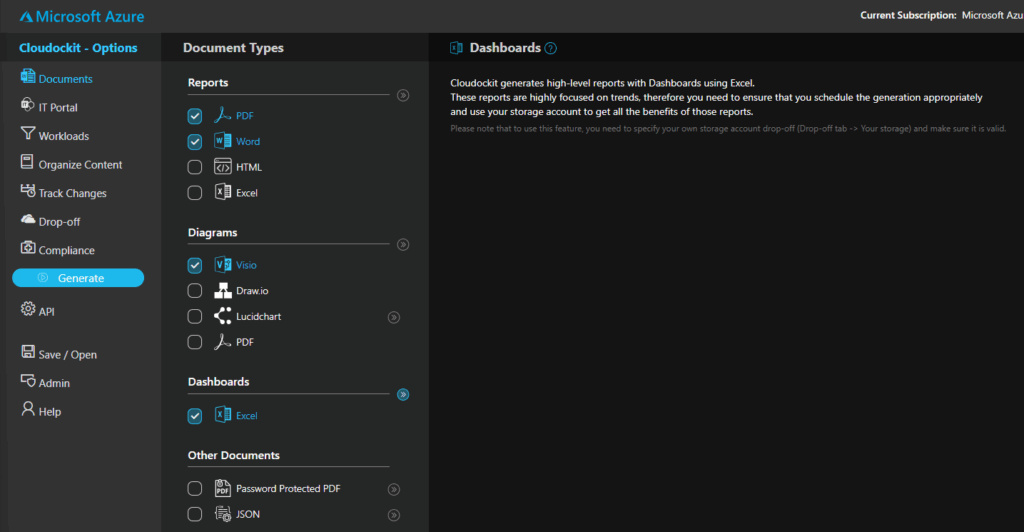
From the Documents tab, select the Excel checkbox.
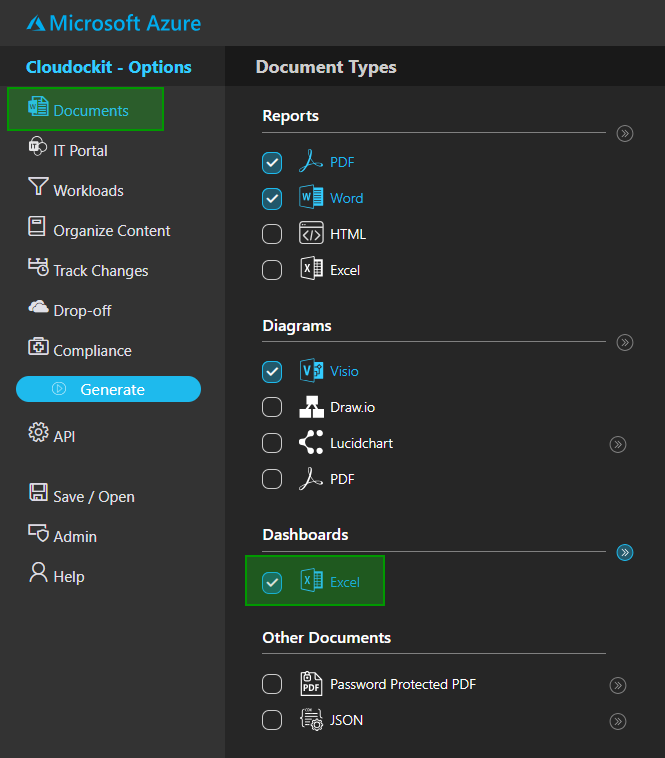
In the corresponding detailed page, select the desired documents output: Excel.
- This will compute the resource changes over the Billing period
Workloads Tab
Select the resource types you wish to include in the scan.
- If you only need the Dashboard documents to be generated, the Billing workload won’t be needed in this case, since it will be automatically set.
- For Azure, this feature uses the Azure Cost Management API to get an overview information on costs, therefore the Standard/EA/CSP do not apply in this case.
- For Google Cloud, the GCPBigQueryDataSet & GCPBigQueryTable of the corresponding selected project, so at this time you can select one project at a time.
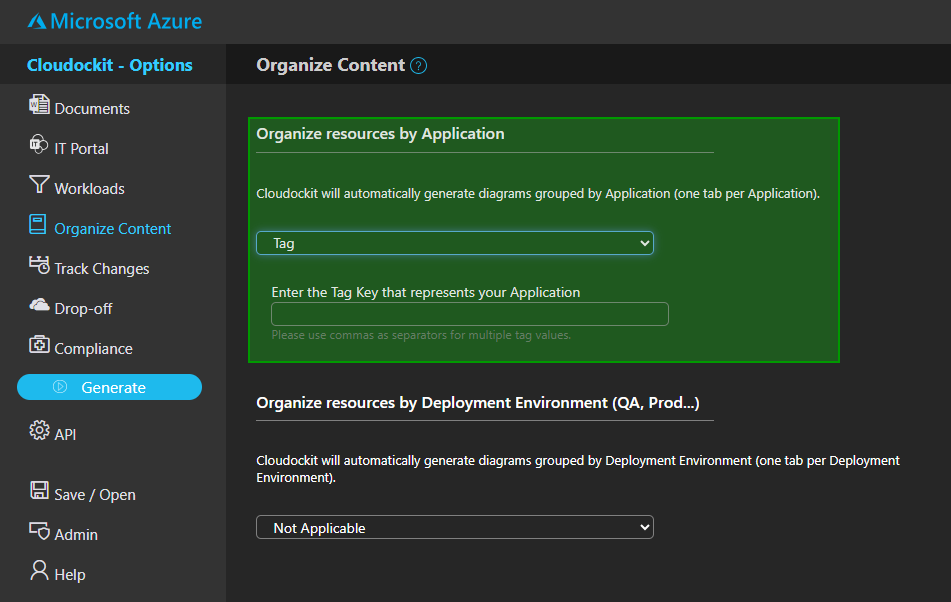
Organize Content Tab
If you wish to have information about your applications, select Tag under Organize resources by application, and enter the tag(s) that represent your application(s).
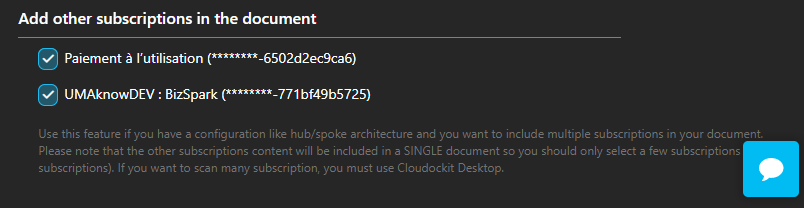
Cloudockit SaaS
To display all the selected subscription information in Cloudockit SaaS, select the checkbox of the subscriptions you want to scan under Add other subscriptions in the document.
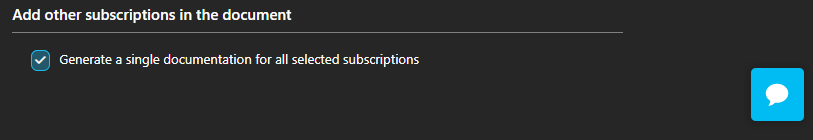
Cloudockit Desktop & Container
To display all the selected subscription information in Cloudockit Desktop or Container, select the checkbox Generate a single document for all selected subscriptions.
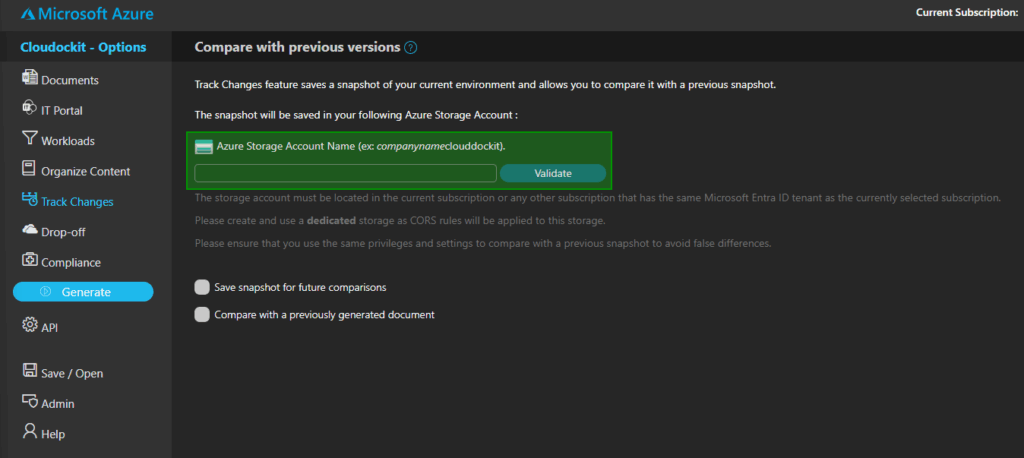
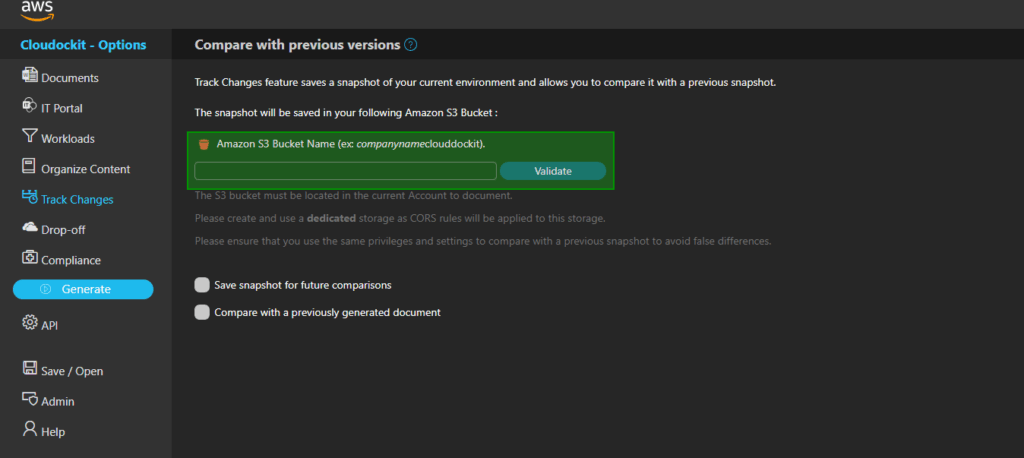
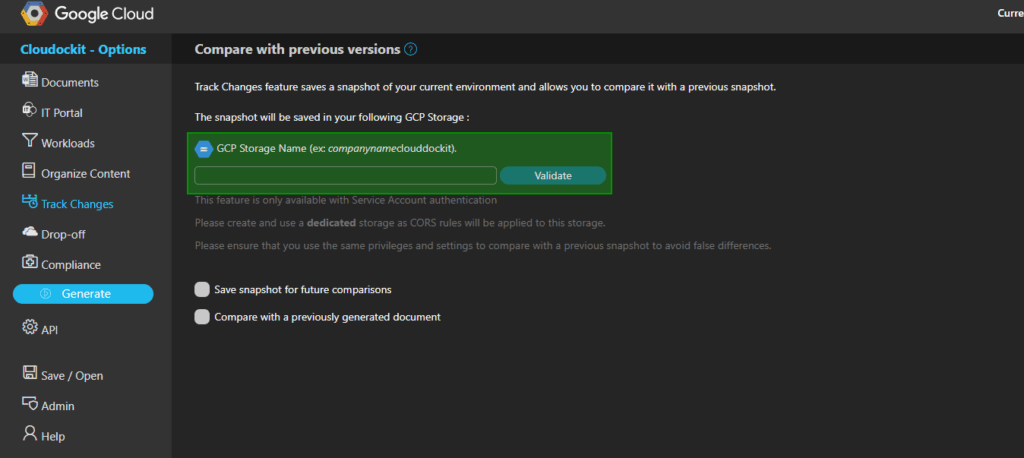
Track Changes Tab
The Track Changes MUST be activated for the Excel Dashboard to work.
Specify a storage location to store the track changes information: Azure, AWS and GCP are presented below:
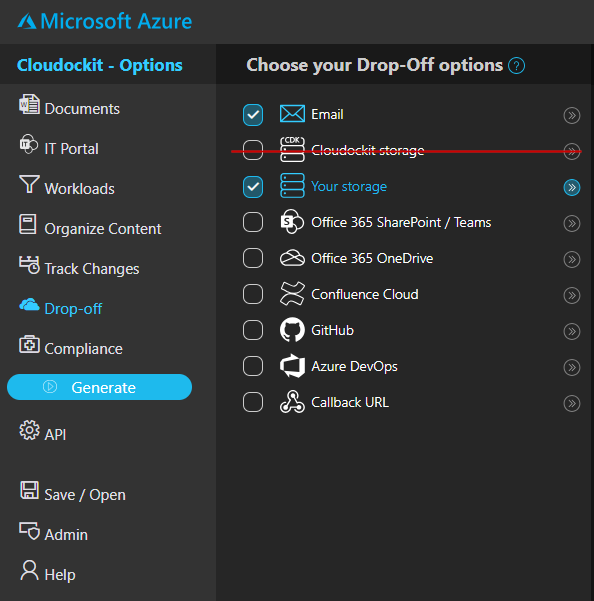
Drop-off Tab
Select your drop-off location while making sure to have a new folder as the drop-off for this configuration.
In the SaaS version, do not select Cloudockit Storage because snapshots used to compute the data changes cannot be stored in that folder.
Scheduling Tab
To have the most accurate results, save the current settings as a schedule.
By doing so, your resource changes and their costs will always be at the same level, and the information displayed will always reflect their current state.
For more information on Scheduling please visit Schedule Documents & Diagrams Generation
IMPORTANT NOTES
It is important to keep the same settings (selected environments, workloads, filters, and drop-off folder) selected to have accurate information displayed from period to period.
If you have different configurations, we recommend having a separate folder in your Drop-Off location for each set of configurations.
If at some point, the selected options are not as expected, the data/cost changes displayed may be inaccurate.