Using Cloudockit for Your Google Cloud Architecture Diagrams
Cloudockit’s Google Cloud architecture diagram tool has been active for more than 2 years, however, many Google Cloud Platform users still don’t know about its existence. Cloudockit is the ONLY cloud diagraming and technical documentation software on the market compatible with GCP. Below is a short guide on how to use Cloudockit with Google Cloud Platform.
The Benefits of Google Cloud Platform
Cloudockit has supported Microsoft Azure and Amazon Web Services years before adding the very important Google Cloud Platform. GCP is a strong contender in the cloud industry; It offers strong services like artificial intelligence, machine learning and big data. Moreover, GCP also offers services in classic fields like services compute and databases.
Even though Google Cloud Platform is a very strong player, it still lacks third party products, unlike Azure and AWS. One of the reasons why Cloudockit decided to support GCP.
How to Use Cloudockit to Monitor Your GCP Cloud Diagrams
Cloudockit is the only tool that allows you to automatically draw cloud diagrams and generate technical documentation for all your Google Cloud Platform projects.
The process is pretty simple: You first login to Cloudockit and select if you want to continue with your Google Account or if you want to connect using a service credential. Once logged in you, will see the list of projects that you have in your Google environment and be able to select one of them to create a diagram or documentation.
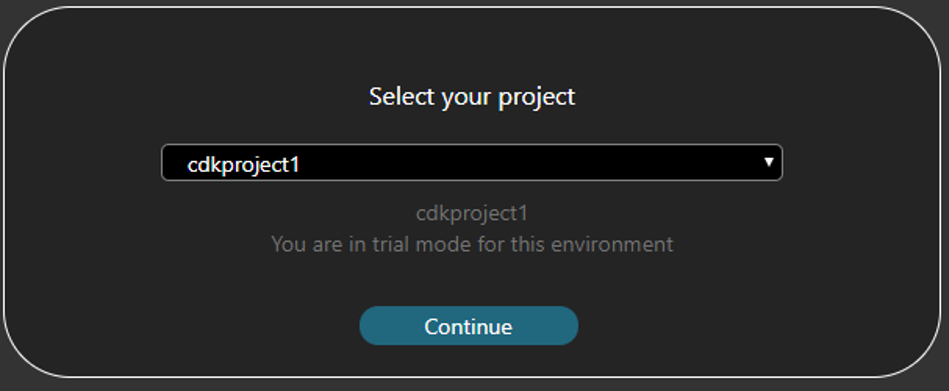
Once you have selected your project you will be asked the type of document you want to generate. For example, you can generate a full PDF or Word document and can also extract a complete Excel report which will contain all the workloads you have in your Google Cloud project.
Cloudockit supports many workloads in Google Cloud like:
- Compute engine
- App engine
- Kubernetes engine
- Cloud functions
- Big table
- Storage
- Cloud SQL
- Spanner and memory store
- VPC network and load balancers
- Cloud IAM
- Cloud pub sub, data flow, IoT Core
Once you have selected the workload you want to document, you just need to click on the generate button and let Cloudockit do the heavy work for you.
Using Cloudockit to document your Google Cloud architecture diagrams has many benefits:
- It will speed up the onboarding process when you have new employees or consultants
- For security reasons, you may want to give someone access to your environment setup and configuration but you do not want to give this person access to the Google Cloud Platform console: Cloudockit will absolutely help you with that.
- You may want to extract the full list of assets you have in all your GCP projects: by using the Excel extraction, Cloudockit will give you this feature out of the box.
- Since you probably do not have an employee who likes to do documentation, you better use a tool like Cloudockit to do it automatically. In addition, it also prevents making mistakes.
- In order to receive an ISO or SOC2 certification, you will need to get complete documentation of your Cloud Environments.
Cloudockit’s diagram generator will save you time and money
Examples of Diagrams and Documentations
The following are examples of documents that get generated automatically by Cloudockit:
Google compute engine named instance-2:
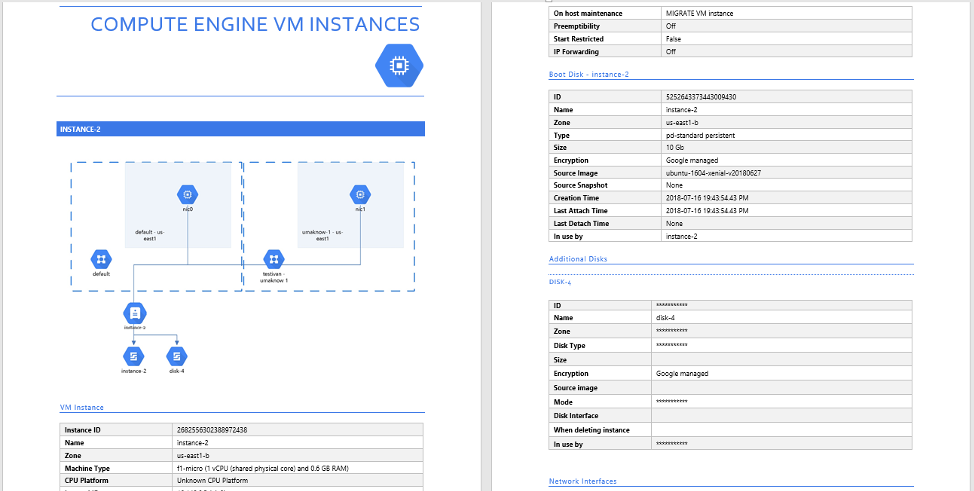
As shown in the diagram, there is a single instance with two network interface cards and 2 hard drives; Each network interfaces are currently placed in different subnets. The document also includes details such as the IP addresses of the network interfaces and the compute instance characteristics including the size and the memory.
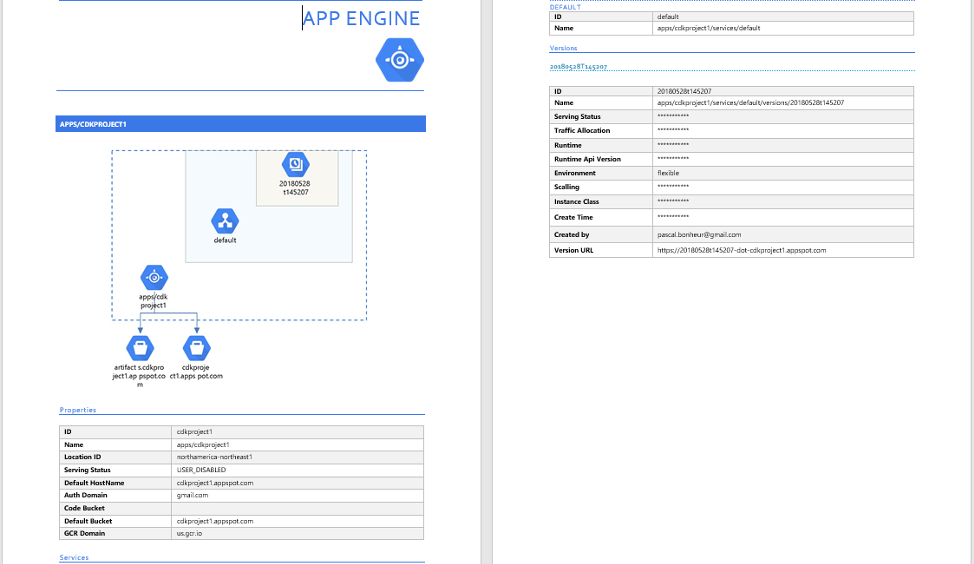
The next example is of an App Engine Named app/cdkproject1 that is connected to 2 storages. As you see below, you get the details of the app engine like the default bucket name and GCR domain. You also get the list of services running in the App Engine and all their versions.
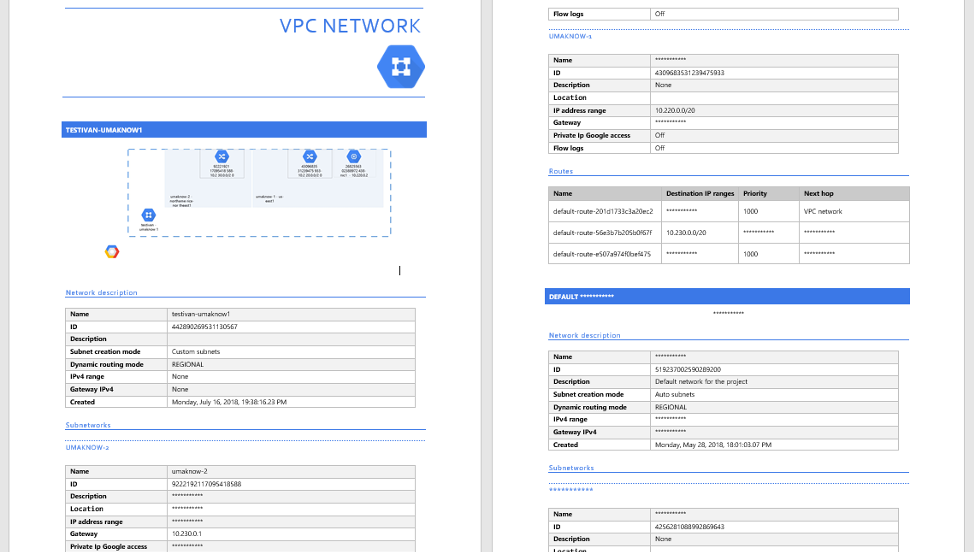
As shown in the next image, you can also see that Cloudockit can give you all the details regarding the VPC networks. It gives you the network description, their routing mode and the list of subnetworks:
Depending on the project you have in your environment, you will see different types of diagrams like complete Kubernetes diagrams if you are using this feature:
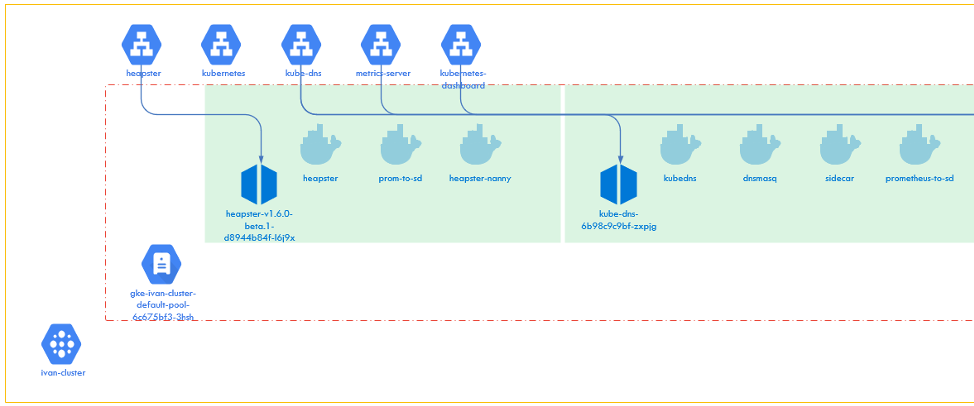
Cloudockit allows you to view many details including the clusters, the nodes, the pods and also the services running in your cluster.
Cloudockit’s Special Features
Cloudockit does not only offer cloud diagrams and technical documentation for your GCP environment. It also has the ability to leverage Google Cloud security command center to automatically extract best practices and find what is wrong in your Google Cloud environment. With the information, Cloudockit automatically generates a full technical report with everything that needs to be debated in your environment in order for you to be compliant with the industrie’s best practices and security recommendations.
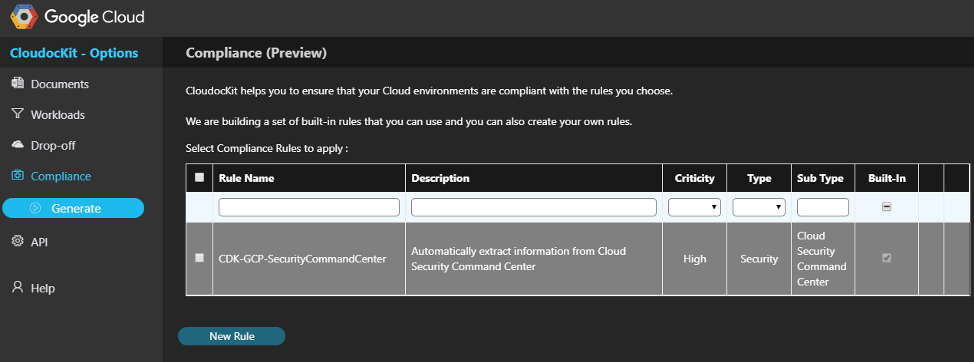
Cloudockit is also available as a windows application that you can run locally in your environment. Cloudockit Desktop (to access Cloudockit Desktop, please contact support@cloudockit.com) can be installed in one of your Google cloud compute instances. Once installed, you can schedule the document generation in order for all of your Google cloud projects to be automatically documented and diagrammed daily.
Also note that Cloudockit supports multiple diagram formats like draw.io, Lucidchart and Microsoft Visio.
Cloudockit is also accessible not only through the user interface but also through a complete rest API that will allow you to call Cloudockit when you want and with the parameters that you want.